Today, We want to share with you Google Responsive Charts (Pie Bar Column) Examples.In this post we will show you Chart with Dynamic Data using Google Charts, hear for Google Charts Tutorials – chart js we will give you demo and example for implement.In this post, we will learn about Draw Multiple Responsive Charts with Google Charts with an example.
Google Responsive Charts (Pie Bar Column) Examples
There are the Following The simple About Google Responsive Charts (Pie Bar Column) Examples Full Information With Example and source code.
As I will cover this Post with live Working example to develop Draw Responsive Charts (Pie Bar Column) using Google Charts, so the some major files and Directory structures for this example is following below.
- index.html
- index.js
- style.css
Creating The Interface
index.html
This is where I will make a simple HTML form and PHP server side source code for our web application. To make the forms simply all souce code copy and write it into your any text editor Like Notepad++, then save file it as index.html.
Google Responsive Charts (Pie Bar Column) Examples
Creating the Script
index.js
google.load("visualization", "1", {packages:["corechart"]});
google.setOnLoadCallback(liveMakeChart1);
function liveMakeChart1() {
  var data = google.visualization.arrayToDataTable([
    ['Year', 'status', 'points'],
    ['2204',  1200,      580],
    ['2205',  1500,      950],
    ['2206',  880,       1300],
    ['2207',  1050,      540]
  ]);

  var options = {
    title: 'Member Performance',
    hAxis: {title: 'Year', titleTextStyle: {color: 'green'}}
 };

var liveChart = new google.visualization.ColumnChart(document.getElementById('responsive_chart1'));
  liveChart.draw(data, options);
}

google.load("visualization", "1", {packages:["corechart"]});
google.setOnLoadCallback(liveMakeChart2);
function liveMakeChart2() {
  var data = google.visualization.arrayToDataTable([
    ['Year', 'status', 'points'],
    ['2113',  1200,      580],
    ['2114',  1500,      950],
    ['2115',  880,       1300],
    ['2116',  1050,      540]
  ]);

  var options = {
    title: 'Member Performance',
    hAxis: {title: 'Year',  titleTextStyle: {color: '#3d3d3d'}},
    vAxis: {minValue: 0}
  };

  var liveChart = new google.visualization.AreaChart(document.getElementById('responsive_chart2'));
  liveChart.draw(data, options);
}

$(window).resize(function(){
  liveMakeChart1();
  liveMakeChart2();
});
Creating the Style CSS
style.css
.liveChart {
  width: 100%;
  min-height: 400px;
}

.row {
  margin: 0 !important;
}
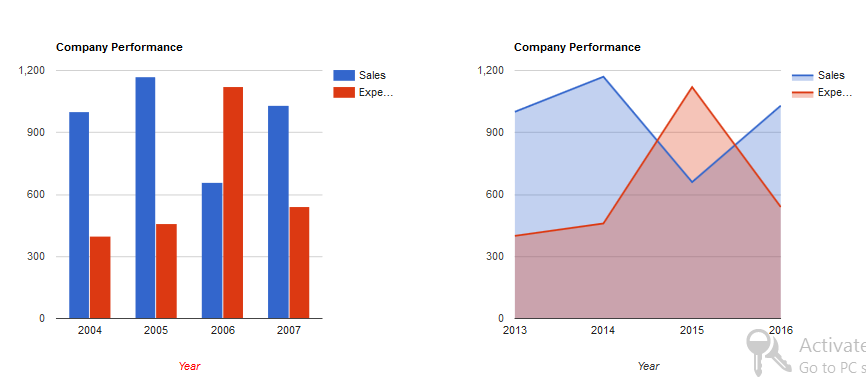
Demo – Make Google Charts Responsive
Google Responsive Charts – output
Angular 6 CRUD Operations Application Tutorials
Read :
Summary
You can also read about AngularJS, ASP.NET, VueJs, PHP.
I hope you get an idea about Google Responsive Charts (Pie Bar Column) Examples.
I would like to have feedback on my Pakainfo.com blog.
Your valuable feedback, question, or comments about this article are always welcome.
If you enjoyed and liked this post, don’t forget to share.